LUFS meter
Measure integrated, short-term and momentary loudness and true peak to ITU-R BS.1770, in your browser.
- Runs in your browser. Nothing is uploaded.
- Space plays AB switch versions
You get integrated loudness, true peak and a loudness graph.
WAV · AIFF · FLAC · MP3 · M4A · OGG
Nothing is uploaded. The measurement runs in a worker on your device.
How it works
- What it does
- Integrated, short-term and momentary loudness, loudness range and true peak, measured to ITU-R BS.1770-5 in your browser. The file stays on your device.
- How it is measured
- K-weighting and 400 ms blocks per ITU-R BS.1770-5, with the −70 LUFS absolute and −10 LU relative gates. True peak uses 8× oversampling. Loudness range follows EBU Tech 3342. On our test set the integrated reading agrees with FFmpeg's ebur128 filter within 0.1 LU. On short files FFmpeg's loudness range can differ, because it takes the 10th percentile one reading lower than the EBU reference code.
Read loudness, peaks and dynamics together
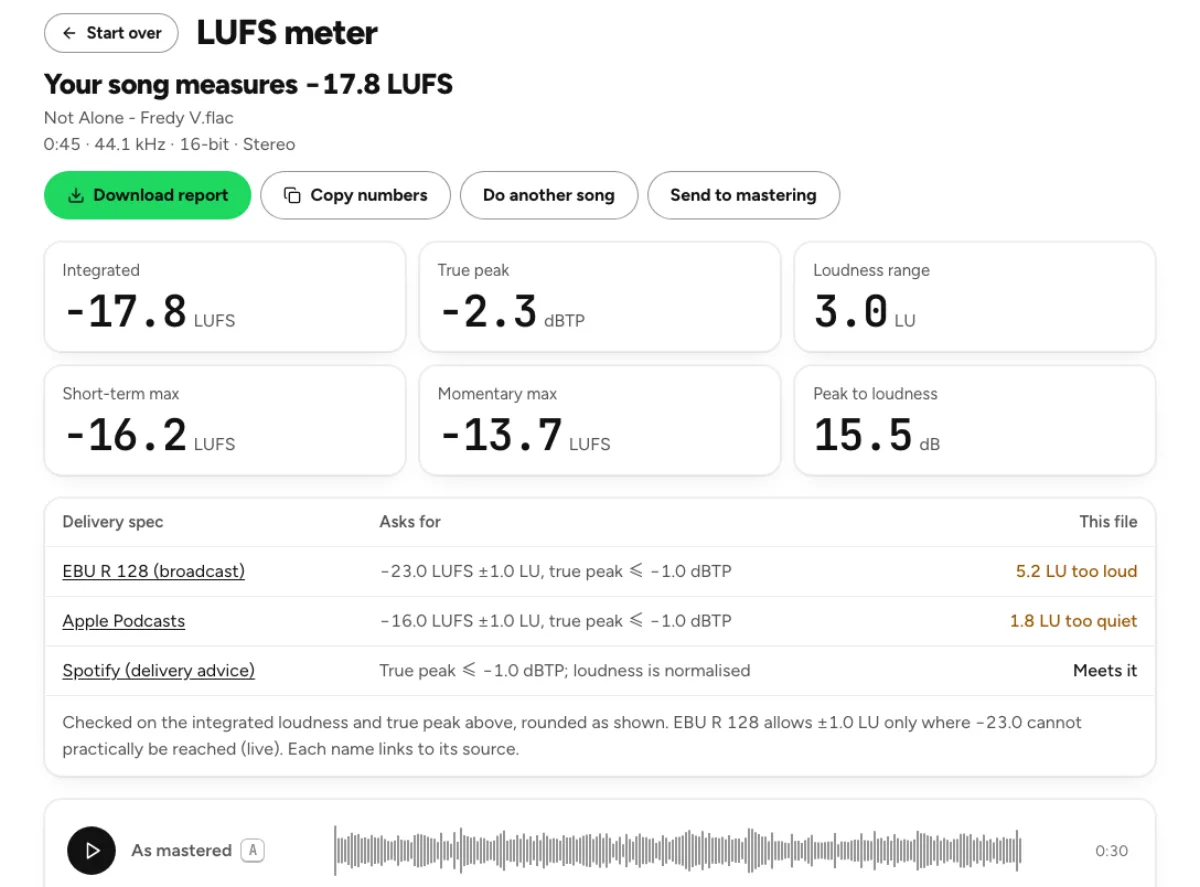
Six readings from one file
Integrated loudness describes the gated average across the file. Short-term maximum and momentary maximum show louder passages over shorter windows. Loudness range describes variation, while true peak and peak-to-loudness ratio give another view of headroom and dynamics. Read these measurements together: two songs can share an integrated value while feeling very different. This LUFS meter measures the audio you give it; it does not change gain, compress a mix or export a louder master.

Measurement with a stated method
The analysis uses K-weighting and gated loudness measurement following ITU-R BS.1770-5, with loudness range calculated using the EBU method. True peak estimates what happens between samples rather than reporting only the largest stored sample. These definitions help you compare readings with another meter using the same method. A test signal verifies one aspect of measurement; it does not guarantee identical results from differently configured meters, selected regions or differently encoded versions of a recording.

See the shape of the whole recording
The short-term graph shows how loudness changes as the track develops. A quiet introduction, a sustained chorus and a long fade can produce a reasonable average while telling very different musical stories. Use the reference line as a reading aid, then listen to the corresponding sections. The batch view also helps compare several bounces or tracks in a sequence. Its purpose is to expose differences you can investigate, rather than prescribe one loudness number for every style. For a practical comparison, keep the playback version and measurement version aligned. If you trim a long silence, add an outro or replace a compressed export, measure the new file rather than carrying over numbers from a previous bounce. A report is a record of that specific audio, not a permanent property of the song title. This is especially useful when several masters have nearly identical filenames and a collaborator needs to know which delivered version a set of readings describes.
Who benefits from measuring a finished file
Mix engineers checking a bounce
Measure the actual exported mix before passing it to mastering. A bus meter inside a session may have measured an earlier playback, an incomplete section or a signal before the final export settings. Reading the file closes that gap. Compare an alternative bounce made with less limiting and look at the change in true peak, integrated loudness and loudness range. Keep the artistic decision in your ears: an extra decibel on the display does not establish which mix communicates better.

Artists sequencing a release
Add several tracks when you want to understand an EP or album as a set. Differences between songs may be intentional, especially when an acoustic interlude sits beside a dense arrangement. Measure each file, listen across the transitions and decide whether a level difference supports the sequence. Use the spread as a prompt for listening rather than automatically forcing every song to match. Album playback and individual-track playback can also use different normalization behavior on the receiving service.

Editors preparing spoken audio
A podcast or interview benefits from a complete-file reading because speech contains pauses, changes of speaker and occasional loud interruptions. Check the integrated figure alongside true peak, then listen to the quietest speaker and the loudest edit. The delivery guidance on the page provides useful reference points, but a distributor or broadcaster may supply a different specification. Verify the current requirement with the destination before delivery, and measure the final encoded file when compression is part of that delivery.
How to measure loudness in the browser
Choose the file you will deliver
Drop a supported audio file or use the built-in demo to learn the display. For a release check, select the final bounce rather than a reference excerpt. A compressed preview can produce different peaks from the original WAV, so choose the version that matches your question. The file is read and analyzed in the browser on your device. Larger recordings require more time and working memory; keep the page open until the analysis finishes and the result appears.
Read the average and inspect exceptions
Start with integrated LUFS, then inspect true peak and the short-term graph. Locate sustained loud sections as well as isolated spikes. A high true peak with a moderate integrated value can indicate a very different situation from a heavily limited song with little headroom. Check any target comparison against the intended delivery context. This page reports a measurement; a warning color is an invitation to review the audio and the specification, rather than proof the recording sounds bad.
Keep a report and choose a next step
Download the CSV report when you need a record of the reading, or send the file to the mastering workspace to make an audible change. Re-measure the resulting export so you compare delivered files using the same method. If your main question is streaming turn-down, use the loudness penalty tool for its platform table. If your question is tonal balance, use the equalizer or studio. Each tool answers a different part of preparing a release.
LUFS measurement questions
What does integrated LUFS tell me?
It summarizes perceived loudness across the complete recording using frequency weighting and loudness gates. It is useful for comparing full programs, but it does not describe every instant or the musical impact of a chorus. Read the short-term graph and peak measurements beside it. Measuring only an excerpt can give a different integrated answer from measuring the full song.
Must every song reach the graph’s reference line?
No. The line is a reference for comparison, not an instruction to master every recording to that number. Genre, dynamics, release context and your listening judgment still matter. Playback services can normalize a file after delivery. Check their current published guidance and use the loudness penalty page to explore the estimated gain change instead of chasing a single universal target.
How is true peak different from sample peak?
A sample peak checks stored digital samples. True peak estimates the reconstructed signal between them, where a higher peak can occur. The value is expressed in dBTP. Encoding to a lossy format can change those peaks again, so a source WAV reading is not a substitute for checking the encoded delivery file when the destination requires it.
Does the LUFS meter alter my audio?
No. This is an analysis tool. It reads the file and displays measurements without changing its dynamics, equalization or loudness. Downloading a report saves numbers, not a processed song. Choose the mastering studio or a suitable processing tool if you want a new audio version, then return here to measure the result independently.
Why can another meter show a different result?
First check that both meters read the same file and the entire recording, including the same start and end. Compare gating settings, true-peak settings and displayed rounding. A live meter that was reset partway through playback is measuring something different from a full-file scan. Silence and extremely short files can also lack enough eligible audio for a useful gated loudness reading.
Can I compare several songs together?
Yes. The batch view gives a result for each file and a view of the collection. It can help spot an unexpected level difference between alternate masters or adjacent album tracks. Still listen to their transitions: measured equality does not guarantee perceived continuity when the instrumentation and frequency balance differ. Keep deliberate contrasts when they serve the sequence.
Does my file leave the device?
The loudness measurement runs locally in your browser. This tool does not upload the recording to perform the analysis. Browser memory and processing speed therefore affect how quickly a large file finishes. Using a separate cloud tool later is a separate action with its own upload and quota behavior; the local meter itself does not require that processing step.
What should I do when the result looks wrong?
Check that you selected the intended export and that it plays correctly. Compare its duration with your expectation, then inspect the graph for unusual silence or a very short fragment. Try the demo to distinguish a file-specific problem from a display problem. If you revise the mix, save a new bounce and measure that file rather than relying on an earlier result.
Learn how
Guides and tutorials that use this tool, with real screens and real numbers.